
PEA Summary
Key Highlights:
- After-tax NPV (5%) of US$329 million and after-tax free cash flow of US$438.8 million at US$50/oz silver.
- After-tax NPV (5%) of US$531.9 million and FCF of US$696.2 million at the current spot price of US$65/oz silver.
- After-tax NPV (5%) of US$991.0 million and FCF of US$1,248.5 million at the last twelve-month high (“LTM”) silver price of US$120/oz.
- Average annual production of 4.1 million oz AgEq over an 8.2-year mine life, with approximately 65% of revenue from silver.
- Life-of-mine average all-in sustaining costs (“AISC”) of US$24.86/AgEq oz payable.
- Initial capital of US$20.9 million.
- Indicated Resources of 15.23 Mt at 201 g/t AgEq, containing 98.2 million AgEq oz, and Inferred Resources of 2.26 Mt at 174 g/t AgEq, containing 12.6 million AgEq oz.
- Mine plan optimization to convert resources and prioritize mining of high-grade areas.
- Exploration targets include near-mine high-grade silver mineralization and a potential higher-grade carbonate replacement deposit (“CRD”) system.
PEA Overview
The PEA outlines an 8.2-year mine life and steady-state throughput of 2,500 tpd beginning in H2 2027, following arrival and commissioning of the new mining fleet and completion of the dry-stack tailings project.
Average annual production is estimated at 4.1 million oz AgEq, with total production of approximately 33.1 million oz AgEq over the life of mine.
The PEA and supporting Mineral Resource Estimate (“MRE”) were prepared in accordance with National Instrument 43-101 – Standards of Disclosure for Mineral Projects (“NI 43-101”) by independent Qualified Persons from SGS Canada Inc. (“SGS”).
PEA Summary Table
| Units | Average LOM | |
|---|---|---|
| Mill Feed | ||
| Mine Life | years | 8.2 |
| Mine Throughput | Mt/year | 0.85 |
| Milling Throughput | t/d | 2,500 |
| Silver Recovery | % | 83.6 |
| Lead Recovery | % | 81.5 |
| Zinc Recovery | % | 81.9 |
| Copper Recovery | % | 77.8 |
| Average AgEq Produced(1) | M AgEqoz/year | 4.1 |
| Average AgEq Payable(1) | M AgEqoz/year | 3.6 |
| Metal Prices | ||
| Silver | $/oz | 50 |
| Copper | $/lb | 4.50 |
| Lead | $/lb | 0.88 |
| Zinc | $/lb | 1.30 |
| Financial Analysis - Base Case | ||
| Pre-Tax NPV(5%) | $M | 545 |
| Pre-Tax IRR | % | 227 |
| Pre-Tax Payback | years | 1.3 |
| After-Tax NPV(5%) | $M | 329 |
| After-Tax IRR | % | 131 |
| After-Tax Payback | years | 2.0 |
| Capital Costs | ||
| Initial | $M | 20.9 |
| Sustaining, including closure | $M | 82.0 |
| Operating Costs | ||
| Mining | $/t | 36.07 |
| Processing | $/t | 23.43 |
| G&A | $/t | 8.08 |
| Subtotal Operating Costs | $/t | 67.58 |
| TC/RCs & Royalties | $/t | 29.51 |
| Sustaining Capital | $/t | 9.90 |
| Total Operating Costs | $/t | 107.00 |
| Cash Operating Costs | $/AgEqoz payable | 15.70 |
| Site AISC Co-Product | $/AgEqoz payable | 24.86 |
| Site AISC By-Product | $/Ag | 11.41 |
Notes:
- Average Produced and Payable excludes values from 2026
- Metal prices for Lead, Zinc, and Gold for both Base and Upside cases are $0.91/lb, $1.21/lb, and $3,000/oz respectively.
- Initial capital is inclusive of all capital spend and owners costs to end of Q1 2027 and includes revenue generation during commissioning period from Q4 2026 to Q1 2027
Mining and Processing
Mining activities under the PEA will initially focus on the Valeria Zone within the existing La Negra underground workings.
Average mining rates, inclusive of waste, are targeted at approximately 2,648 tpd over the life of mine.
The mine plan benefits from extensive existing underground development, while production is sourced from new mining areas.
The processing facility consists of conventional crushing, grinding, flotation and filtration and produces lead-silver, copper-silver and zinc concentrates.
Life-of-mine metallurgical recoveries average:
- Silver: 83.6%
- Copper: 77.8%
- Lead: 81.5%
- Zinc: 81.9%
Production Schedule
| Units | 2026(3) | 2027 | 2028 | 2029 | 2030 | 2031 | 2032 | 2033 | 2034 | LOM | |
|---|---|---|---|---|---|---|---|---|---|---|---|
| Mill Feed | |||||||||||
| Milled (kt) | Kt | 240 | 700 | 912 | 912 | 912 | 912 | 912 | 909 | 492 | 6,902 |
| Ag Feed Grade | g/t | 55 | 71 | 77 | 80 | 123 | 146 | 149 | 157 | 118 | 114 |
| Cu Feed Grade | % | 0.50 | 0.47 | 0.42 | 0.43 | 0.37 | 0.34 | 0.29 | 0.21 | 0.19 | 0.35 |
| Pb Feed Grade | % | 0.17 | 0.33 | 0.39 | 0.45 | 0.76 | 0.98 | 1.18 | 1.19 | 1.48 | 0.80 |
| Zn Feed Grade | % | 1.48 | 1.34 | 1.33 | 1.54 | 2.07 | 2.30 | 2.46 | 2.40 | 1.88 | 1.92 |
| Recoveries | |||||||||||
| Ag | % | 78.8% | 81.1% | 81.8% | 82.1% | 84.6% | 85.3% | 85.4% | 85.6% | 84.4% | 83.6% |
| Cu | % | 80.3% | 80.0% | 79.4% | 79.5% | 78.7% | 78.1% | 77.2% | 74.4% | 73.0% | 77.8% |
| Pb | % | 74.7% | 79.4% | 80.2% | 80.7% | 82.2% | 82.7% | 83.0% | 83.0% | 83.3% | 81.5% |
| Zn | % | 80.6% | 79.9% | 79.8% | 80.9% | 82.6% | 83.2% | 83.5% | 83.4% | 82.1% | 81.9% |
| Metal Recovered to Concentrate | |||||||||||
| Ag | Koz | 335 | 1,293 | 1,850 | 1,936 | 3,052 | 3,654 | 3,721 | 3,932 | 1,575 | 21,349 |
| Cu | Mlbs | 2.1 | 5.8 | 6.6 | 6.8 | 5.8 | 5.3 | 4.5 | 3.2 | 1.5 | 41.8 |
| Pb | Mlbs | 0.7 | 4.1 | 6.4 | 7.3 | 12.7 | 16.4 | 19.9 | 20.0 | 13.5 | 99.9 |
| Zn | Mlbs | 6.3 | 16.6 | 21.4 | 25.2 | 34.5 | 38.7 | 41.5 | 40.3 | 16.8 | 240.0 |
| AgEq Produced (1) | koz | 702 | 2,319 | 3,111 | 3,330 | 4,691 | 5,416 | 5,548 | 5,609 | 2,377 | 33,108 |
| Payable Metals | |||||||||||
| Ag | Koz | 293 | 1,151 | 1,659 | 1,732 | 2,762 | 3,323 | 3,388 | 3,593 | 1,448 | 19,350 |
| Cu | Mlbs | 2.0 | 5.6 | 6.3 | 6.5 | 5.6 | 5.0 | 4.3 | 3.0 | 1.4 | 39.8 |
| Pb | Mlbs | 0.6 | 3.8 | 5.9 | 6.8 | 11.7 | 15.2 | 18.4 | 18.5 | 12.5 | 93.5 |
| Zn | Mlbs | 5.2 | 13.5 | 17.4 | 20.6 | 28.2 | 31.6 | 33.9 | 33.0 | 13.7 | 197.1 |
| AgEq Payable (2) | koz | 621 | 2,072 | 2,786 | 2,973 | 4,204 | 4,867 | 4,984 | 5,049 | 2,152 | 29,707 |
Average annual production is forecast at 4.1 Moz AgEq, for total production of approximately 33.1 Moz AgEq over the life of mine.
Notes:
- AgEq Produced represents the total value of all recovered metals expressed in silver ounces. This is calculated by converting by-product metal production (copper, lead, and zinc) into silver ounces based on the relative value of their price assumptions compared to the silver price assumption.
- AgEq Payable represents the total value of all payable metals expressed in silver ounces. This is calculated by converting by-product payable metal (copper, lead, and zinc) into silver ounces based on the relative value of their price assumptions compared to the silver price assumption.
- 2026 represents a half year and is from July 1, 2026 onwards
Tailings Management
The Company is installing a tailings thickener and filter press to move to filtered (dry-stack) deposition, targeted for commissioning and ramp-up in H1 2027.
Filtered deposition is designed to increase operational flexibility, improve water recovery and reduce the operation's freshwater draw.
The project is intended to provide additional tailings capacity and support the planned increase to 2,500 tpd.
Silver Revenue
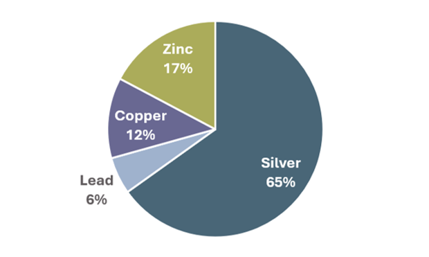
Approximately 65% of the projected life-of-mine Net Smelter Return (NSR) revenue is generated from silver production.
The remaining 35% of NSR revenue is comprised of:
- Copper – 12%
- Lead – 6%
- Zinc – 17%
Forecasted Operating Cost
Life-of-mine cash operating costs are estimated at US$67.59/t, while site AISC is estimated at US$24.86/AgEq oz payable.
| Operating Costs | LOM Total ($M) | Unit Cost ($/t) | Unit Cost ($/AgEq oz payable) |
|---|---|---|---|
| Mining | 249.0 | 36.07 | 8.38 |
| Processing | 161.8 | 23.43 | 5.45 |
| General & Administrative | 55.8 | 8.08 | 1.88 |
| Total Cash Operating Costs | 466.5 | 67.59 | 15.70 |
| TC/RCs & Royalties | 203.7 | 29.51 | 6.86 |
| Total Cash Costs | 670.2 | 97.10 | 22.56 |
| Net Sustaining Capital Costs | 68.3 | 9.90 | 2.30 |
| Total Site AISC(1) | 738.5 | 107.00 | 24.86 |
Notes:
- PEA AISC excludes exploration and corporate costs. AISC does include grade control and infill drilling.
Life-of-Mine Capital Summary
Initial growth capital requirements are forecast at US$20.9 million over 2026 and 2027. At base case prices, only US$12.5 million is required to be funded from the balance sheet with the remainder funded by cash flow from La Negra. At spot prices this decreases to less than US$5 million.
Initial capital consists primarily of:
- New mining fleet
- Completion of the dry-stack tailings project
- Minor underground infrastructure upgrades
Sustaining capital is estimated at US$68.3 million over the life of mine.
| LOM Capital | Cost ($M) |
|---|---|
| Growth Capital | 20.9 |
| Sustaining Capital | 68.3 |
| Closure(1) | 13.7 |
| Net Sustaining Capital | 82.0 |
| Total LOM Capital | 102.9 |
Notes:
- Net of $1.6 M of salvage value
Forecast Return Estimates
The base case outlines an after-tax NPV (5%) of US$329 million and an after-tax payback period of 2.0 years at US$50/oz silver at spot prices this increased to US$532 million and a 0.7-year payback.
| Metric | Units | Break-even | -30% | Base case | Spot(2) | LTM High |
|---|---|---|---|---|---|---|
| Silver price | $/oz | 26.8 | 35.0 | 50.0 | 65.0 | 120 |
| Copper price | $/lb | 2.4 | 3.2 | 4.5 | 6.5 | 6.90 |
| Lead price | $/lb | 0.5 | 0.6 | 0.9 | 0.9 | 0.95 |
| Zinc price | $/lb | 0.7 | 0.9 | 1.3 | 1.8 | 1.80 |
| Pre-tax NPV (5%) | $M | 33.9 | 215.1 | 545.1 | 864.1 | 1,581.4 |
| Pre-tax IRR | % | 14% | 60% | 227% | 1,934% | - |
| Pre-tax payback | years | 6.1 | 3.7 | 1.3 | 0.6 | - |
| After-tax NPV(5%) | $M | - | 116.1 | 328.7 | 531.9 | 991.0 |
| After-tax IRR | % | 5% | 40% | 131% | 511% | - |
| After-tax payback | years | 6.9 | 4.4 | 2.0 | 0.7 | - |
| Undiscounted after-tax cash flow | $M | 19.2 | 166.5 | 438.8 | 696.2 | 1,284.5 |
| LOM revenue (NSR) | $M | 671.7 | 915.9 | 1,360.3 | 1,787.7 | 2,765.3 |
| LOM EBITDA | $M | 167.5 | 397.1 | 815.1 | 1,216.9 | 2,132.1 |
| AISC | $/AgEq oz | 23.4 | 23.9 | 24.9 | 26.7 | 38.5 |
| After-tax NPV(5%)/ growth capital | x | - | 5.6 | 15.7 | 25.5 | 47.5 |
Notes:
- PEA AISC excludes exploration and corporate costs. AISC does include grade control and infill drilling.
Growth and Next Steps
- New Epiroc mining fleet arriving through Q4 2026 and Q1 2027.
- Filtered dry-stack tailings facility targeted for commissioning and ramp-up in H1 2027.
- Mine plan optimization and target grade increases under evaluation.
- 15,000 metre surface and underground drill program underway.
- Continued evaluation of opportunities to expand the Mineral Resource base and optimize the mine plan as new drill data becomes available.
PEA Cautionary Statement
The PEA is preliminary in nature. It includes Inferred Mineral Resources that are considered too speculative geologically to have the economic considerations applied to them that would enable them to be categorized as Mineral Reserves, and there is no certainty that the PEA will be realized.
Mineral Resources that are not Mineral Reserves do not have demonstrated economic viability.
The Company has no Mineral Reserves at La Negra.
The production schedule underlying the PEA includes approximately 79% Indicated and 21% Inferred Mineral Resources by tonnage.
There is no certainty that Inferred Mineral Resources will be upgraded to Indicated or Measured Mineral Resources with further exploration, or that any Mineral Resource will be converted to a Mineral Reserve.
Qualified Persons
The Mineral Resource Estimate was prepared by Allan Armitage, Ph.D., P.Geo. of SGS Geological Services, an independent Qualified Person as defined by NI 43-101. Dr. Armitage completed site visits to the Project on March 23-24, 2026 and June 12-13, 2026.
William van Breugel, P. Eng. an associate engineer of SGS Geological Services, an independent Qualified Person as defined by NI 43-101, having responsibility for the project economics including capital expenditures, operating expenditures, financials, and sensitivities.
Johnny Canosa, P. Eng. of SGS Geological Services, an independent Qualified Person as defined by NI 43-101, having responsibility for the mining methods, infrastructure, and environment, permitting & social or community impact.
Henri Gouin, P. Eng. of SGS Geological Services, an independent Qualified Person as defined by NI 43-101, having responsibility for the underground mining planning and schedule. Mr. Gouin completed a site visit to the Project on June 12-13, 2026.
Shaohai Yu, P. Eng of SGS North America, an independent Qualified Person as defined by NI 43-101, having responsibility for the mineral processing, metallurgical testing, and recovery methods.
The scientific and technical information contained in this news release has been reviewed and approved by Nico Harvey, P.Eng., Vice President Project Development of Silverco, a Qualified Person as defined in National Instrument 43-101. Mr. Harvey is not independent of the Company. Mr. Harvey has reviewed the technical information disclosed herein.
Technical Report
The report supporting the PEA will be available on SEDAR+ and on the Company's website within 45 days of the September 21, 2026 news release.
Technical Report – Coming Soon